Tropical Cyclone Alfred has been a very interesting and complex storm system and one that has been difficult to forecast.
The storm was born on Sunday 23 February and only started to cross the coast during Friday and Saturday 7 and 8 March 2025 over northeast New South Wales and south east Queensland.
Some interesting facts for this storm include:
- It has had a life span of at least 13 to 14 days.
- It has been very slow moving. So slow in fact that its movement has been as low as 7 km/h. This is at a speed that a fast walker would or could travel at.
- The storm has peaked at a Category 4 system under the Saffir Simpson Scale and the Australian Tropical Cyclone Intensity Scale 1989. At one stage of its life span, the storm became quite strong.
- Its slow movement at final landfall is contributing to higher rainfall totals.
Following its birth, the storm moved slowly away from the Queensland coast, then turned south then turned west to make landfall where a large population centre exists being the Sunshine Coast, Brisbane and Gold Coast.
Its impact has been felt further afield into northeast New South Wales and indeed, the strongest verified wind gusts has occurred at a weather station at Cape Byron (New South Wales) where a single peak wind gust of 113 km/h has been recorded.
Intensity of the storm under the "Saffir Simpson Scale"
The Saffir Simpson Scale is reproduced below.
| Category | knots | km/h | Metres per second |
| 5 | 137 | 252 | Greater than 70 |
| 4 | 113 to 136 | 209 to 251 | 58 to 70 |
| 3 | 96 to 112 | 178 to 208 | 50 to 58 |
| 2 | 83 to 95 | 154 to 177 | 43 to 49 |
| 1 | 64 to 82 | 119 to 153 | 33 to 42 |
| Tropical Storm | 34 to 63 | 63 to 118 | 18 to 32 |
| Tropical Depression | Less than 33 | Less than 62 | Less than 17 |
At peak intensity, the storm reached low end Category 4 (In bold) with peak wind gusts somewhere between 209 and 251 km/h. It should be noted that there were no weather stations in its path while out at sea but CIMSS modelling does show a powerful storm of this calibre.
At landfall given the available information, the storm was at tropical storm strength.
This only accounts for wind only. It does have its shortcomings in which it does not account for rainfall amounts.
Intensity of the storm under the "Australian Tropical Cyclone Intensity Scale 1989"
The Australian Tropical Cyclone Intensity Scale 1989 is reproduced below.
| Category | Sustained winds in km/h | Wind Gusts in km/h |
| 5 | 198 | 280 |
| 4 | 159 to 198 | 226 to 280 |
| 3 | 119 to 157 | 167 to 224 |
| 2 | 89 to 117 | 126 to 165 |
| 1 | 63 to 87 | 91 to 124 |
| Tropical Storm or low | Below 63 |
At peak intensity, the storm reached Category 4 (In bold highlight).
At landfall given the available information, the storm would indeed fit into a low end Category 2 system.
The shortcoming of this is that the Australian Tropical Cyclone Intensity Scale sets lower thresholds for such storms.
Thus, while the CIMSS forecast modelling was showing a tropical storm system (Tuesday to Friday before landfall) with peak winds of 50 to 55 knots off the southeast coast of Queensland, the Australian models were indeed showing the same storm system with similar winds but as a Category 2 tropical cyclone system.
Verified Wind speeds
A weather station at Cape Byron (New South Wales) has some of the best recordings and data available.
For 4 days (Wednesday to Saturday), there have been peak wind gusts reaching or just exceeding 100 km/h as shown in the table below:
| Cape Byron | Peak wind in km/h | Time | Comment |
| Wednesday | 106 | 9 am | Occasional gusts over 100 km/h but mostly below this. |
| Thursday | 104 | 3 pm | Gusts vary from 65 km/h to 95 km/h |
| Friday | 113 | 5.30 am | Between 4 am and 7 am, there were various gusts to 100 km/h across a 3 hour period. |
| Saturday | 104 | 5.34 am | Winds have eased somewhat since. |
If this was extrapolated against the Saffir Simpson Scale and the Australian Tropical Cyclone Intensity Scale produced above, (just prior to landfall) this would comfortably sit within:
- Tropical storm under the Saffir Simpson Scale.
- At least Category 1 under the Australian Tropical Cyclone Intensity Scale 1989.
Southport (Gold Coast)
A wind gust of 100 km/h also occurred at 10.30 pm Friday evening. There was also a period between 7.30 pm and 10 pm where several peak gusts topped 91 to 98 km/h. Other than this, peak wind gusts were much lower.
Yamba
There were three peak wind gusts to 95 km/h between 11.25 am and 11.30 am late Friday morning.
Wind damage has occurred and widespread power outages have resulted.
Irrespective of the categories and methods used to calculate its strength, the storm system has displayed unusual characteristics. Rainfall has been so much higher than what would normally occur.


Rainfall
The heaviest falls have been within the ranges and hills of the coastal escarpment rather than along the immediate coastal areas and coastline.
In addition, there has been intense rainfall within the hills south west of Coffs Harbour due to a train echo effect and orographic rainfall. This area includes the Bellinger Valley and regions around Dorrigo and Point Lookout.
Given the prolonged nature of this system which is still ongoing, the heaviest rainfall that has occurred to 9 am Saturday morning 8 March is outlined below:
To 9 am Wednesday 5 March 2025
- Careys Peak (Barrington Tops) - 143 mm.
- Mt Barrington (Barrington Tops) - 139 mm.
- Upper Chichester - 72 mm.
Closer to the weather system:
- Coffs Harbour (Bakers Road) - 52 mm.
- Other regions of Coffs Harbour - 29 mm to 46 mm.
To 9 am Thursday 6 March 2025
- Dorrigo - 237 mm.
- Meldrum (Upper Bellinger Valley) - 235 mm.
- Dorrigo (Bielsdown Creek) - 224 mm.
- Lowanna - 119 mm.
- Coffs Harbour region - 8 mm to 40 mm.
Heavy rainfall fell within the Bellinger Valley where orographic rainfall has featured. Such rainfall is limited to a small area. Generally, the heaviest rainfall is within the hills close to and within the coastal escarpment.
- Mullumbimby - 168 mm.
- Terania Green - 134 mm.
- Goonengerry - 129 mm.
- Other localities - 50 to 99 mm.
Heavy rainfall occurred along the border of Queensland with New South Wales with totals just topping 100 mm.
To 9 am Friday 7 March 2025
- Meldrum (Upper Bellinger Valley) - 228 mm (Two day total tops 463 mm).
- Dorrigo (Bielsdown Creek) - 223 mm (Two day total tops 447 mm).
- Dorrigo - 211 mm (Two day total tops 448 mm).
- Point Lookout - 147 mm.
Away from the Bellinger Valley - Northern Rivers and Tweed region:
- Nimbin - 184 mm.
- Upper Burringbar - 181 mm.
- Mullumbimby Creek - 155 mm.
- Lismore - 147.8 mm.
- Ballina - 90.2 mm.
Southern Gold Coast
- Lower Springbrook Alert - 165 mm.
- Upper Running Creek - 157 mm.
- Oyster Creek Alert - 136 mm.
- The whole southern region close to the New South Wales state border experienced falls of at least 100 mm.
To 9 am Saturday 8 March 2025
- Dorrigo (Bielsdown Creek) - 264 mm (Three day total tops 711 mm).
- Lowanna - 249 mm.
- Dorrigo - 180 mm (Three day total tops 628 mm).
- Meldrum (Upper Bellinger Valley) - 178 mm (Three day total tops 641 mm).
- Point Lookout - 125 mm.
Away from the Bellinger Valley:
- Boyles Bridge (Coffs Harbour region) - 222 mm.
- Woolgoolga (Coffs Harbour - 146 mm.
Away from Coffs Harbour region:
- Mullumbimby - 171 mm.
- Bentley - 155 mm
- Lismore Airport - 133 mm.
Queensland
Extensive 100 mm plus totals occur across the Gold Coast region plus south eastern Brisbane city. The heaviest falls include:
- Lower Sprungbrook Alert - 251 mm.
- Upper Tallebudgera Alert - 222 mm.
- Biggera Creek Dam Alert - 151 mm.
With such extensive rainfall across the region, moderate to major flooding has occurred in any low lying area which is not just limited to the Bellinger Valley or Lismore.
Flooding is occurring along the Richmond and Tweed Rivers and watercourses west of the Gold Coast.
At the time of writing road closures have occurred due to flooding including:

New South Wales
- Waterfall Way (Bellinger Valley) - Landslides and flooding.
- Various roads around Grafton due to flooding (South Grafton particularly affected).
- Gwyder Highway (North west of Grafton).
- Various roads around Maclean.
- Various roads around Lismore (Spread across the town).
- Summerland Way north of Casino.
Queensland
Extensive hazards and floods across the Gold Coast City and south east Brisbane with numerous roads impacted.
This event is ongoing with more rainfall expected. It is expected that rainfall totals will continue to edge higher with further flooding as the storm system completes its landfall during Saturday and Sunday.

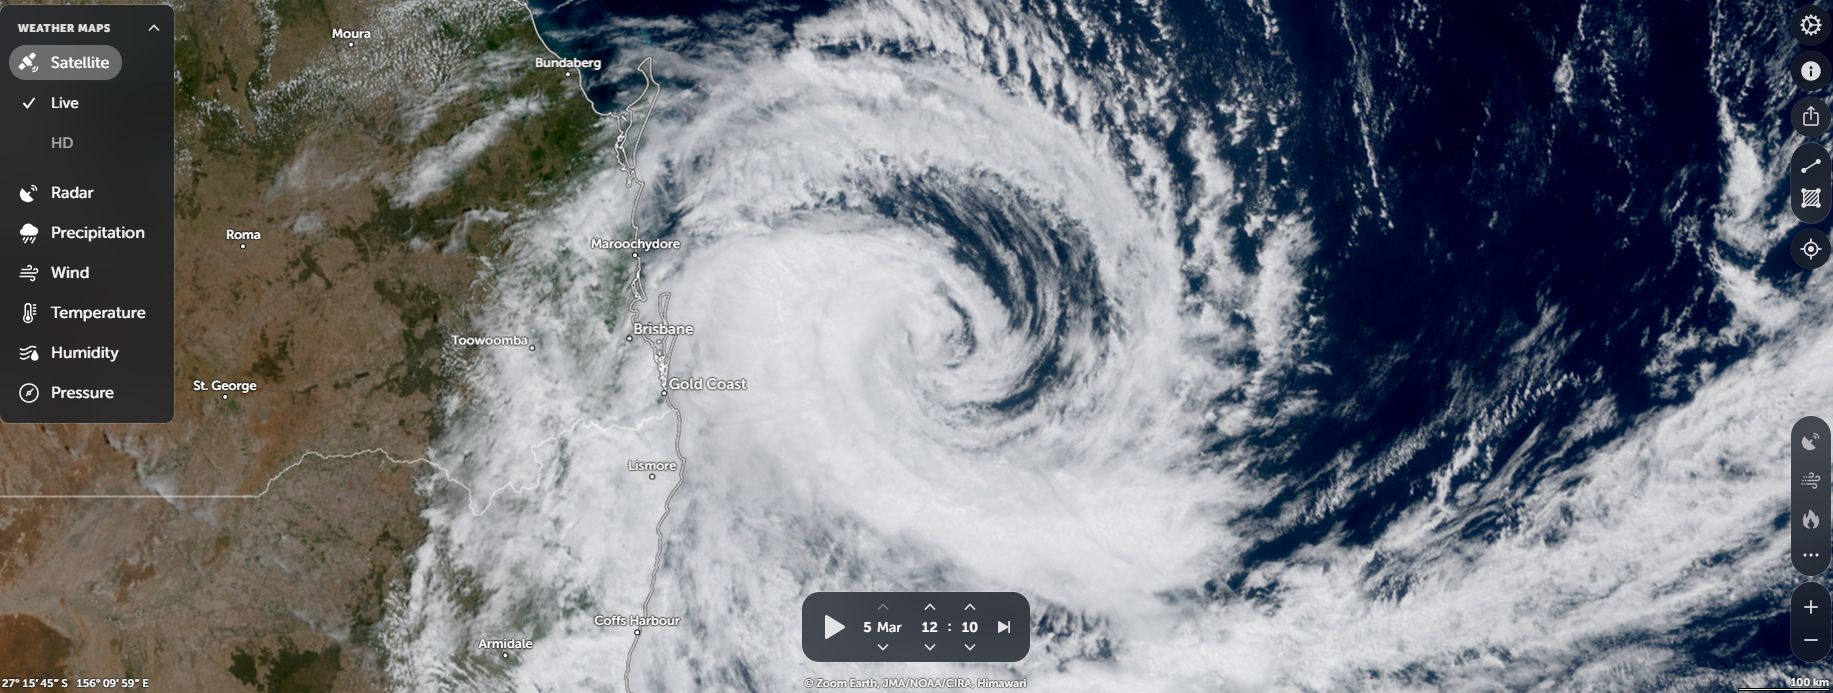
Attached are some images of the storm as it was slowly edging closer to south east Queensland using Zoom Earth (NASA). The images show a very interesting and slow moving storm system but one without a true eye at the core of the system.