The month of October 2022 can best be described as an exceptional month in terms of rainfall. Several key rain events throughout the month have resulted in incredible rainfall totals being recorded especially across the Murray Darling Basin. This in turn has contributed to significant flooding with most major inland rivers being in flood.
Some of the worst flooding occurred across the Central West and Northern inland of the New South Wales and northern Victoria. Significant floods impacted:
New South Wales
Dubbo.
Forbes.
Narribri.
Moree.
Moderate and major flooding is still occurring across the Darling River, Lachlan River and Murrumbidgee Rivers.
Victoria
Shepparton.
Echuca.
Now major flooding is being experienced between Swan Hill and Echuca along the Murray River as the flood peaks slowly move downstream into the lower reaches of the river.

However, a second flood peak is occurring further upstream between Echuca and the Hume Reservoir dam wall where flood levels are at moderate levels but in some areas, the flood levels are barely below major peak levels.
Exceptional rainfall, constant cloud cover has had a remarkable impact on maximum daytime temperatures and even now, almost halfway into November, there has barely been a single day when 30C has been reached across Western Sydney. It has reached 30.5C only in Richmond on the 31 October 2022. No other weather station across Sydney has recorded such temperatures to date for the spring / summer season 2022/2023.
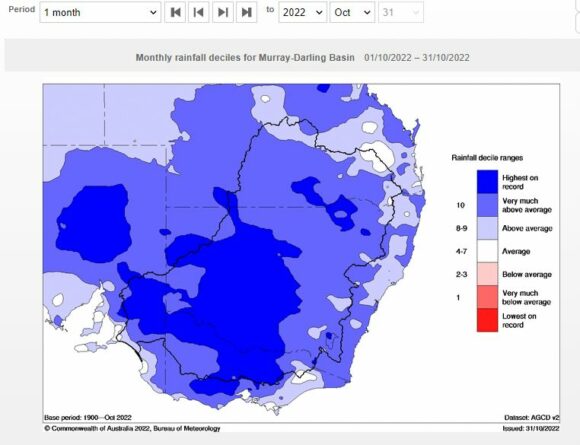
Rainfall deciles for south east Australia and the Murray Darling Basin for October 2022 showing record rainfall for inland areas
All the rain events that have occurred are covered in various separate statements but the standout is the amount of rain that has fallen. While rainfall across some coastal locations have exceeded 2,500 mm, there are now inland locations that have exceeded 1,000 mm for the year. This is exceptional and unusual.
Rainfall table at selected locations for October 2022
| Sydney Region | October 2022 | So far for 2022 | Comment |
| Parramatta | 161 mm on 20 days. | 1,722.2 mm. | |
| Penrith | 72.4 mm on 7 days. | 1,540.4 mm. | |
| Richmond | 117.8 mm on 17 days. | 1,442.6 mm. | |
| Sydney Observatory Hill | 295.4 mm on 22 days. | 2,396.2 mm. | New record set and wettest year recorded. |
| Home (Comparison and guide only) | 137.3 mm on 18 days. | 1,644 mm.
|
It is calculated that rain has fallen on 152 days throughout the 10 months of 2022 to October 31. |
| North Coast NSW | October 2022 | So far for 2022 | Comment |
| Ballina | 247.2 mm on 19 days. | 2,749.6 mm. | |
| Coffs Harbour | 246.6 mm on 21 days. | 2,482.4 mm. | |
| Dorrigo | 221.6 mm on 18 days. | 2,801.7 mm. | |
| Grafton | 116.4 mm on 17 days. | 1,544 mm. | |
| Port Macquarie | 79.2 mm on 11 days
|
2,266 mm. | This could now be incorrect given that the weather station was not recording between the 21 and 26 October.
The final figure for 2022 will now be in doubt for the records. |
| Wheat Sheep Belt NSW | October 2022 | So far for 2022 | Comment |
| Albury Airport | 198 mm on 20 days. | 1,050.8 mm. | More than 1,000 mm for the year. |
| Dubbo | 195.8 mm on 16 days. | 978.6 mm. | |
| Forbes | 143.4 mm on 14 days. | 802 mm. | |
| Tamworth | 148.8 mm on 16 days. | 788.8 mm. | |
| Wagga Wagga | 145.8 mm on 20 days. | 650.6 mm. |
Discussion Water and the Land plots
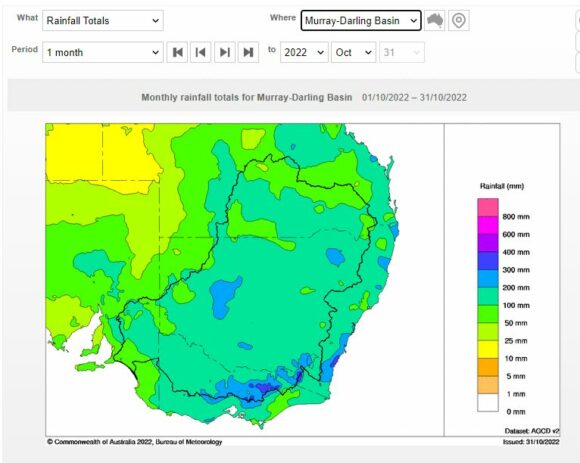
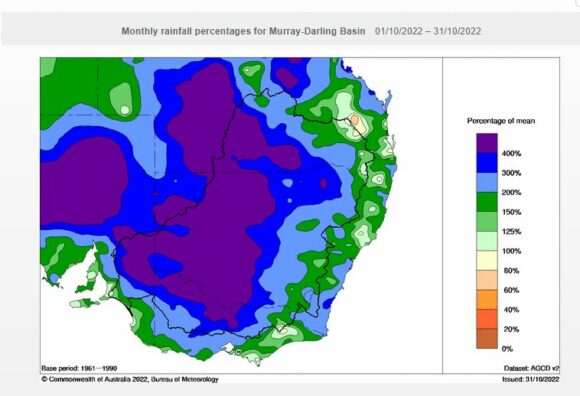
Attached are relevant Water and the Land Plots showing rainfall for October 2022 to reinforce the discussion above. The standout figures are:

- All parts of eastern Australia were wet with very few areas missing out.
- Rainfall was the highest on record for many inland areas including northern Victoria.
- Rainfall was as much as 300% to 400% above the norm for a large region of the Murray Darling Basin.
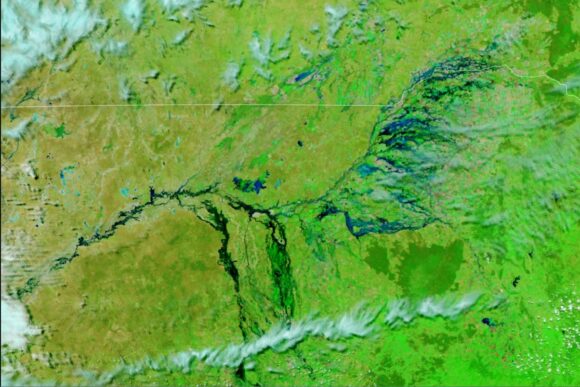
The attached image from NASA from the "Visible Infrared Imaging Radiometer Suite" (VIIRS) on the SUOMI NPP satellite clearly shows the extent of flooding across parts of inland northern New South Wales during late October. Waves of heavy rain have left rivers swollen. This image is taken on Saturday October 29 with the flooding clearly visible.

This image reinforces and shows how wet October 2022 has been.
1 - All rainfall and historical rainfall used is sourced from the Bureau of Meteorology historic data and data from official weather stations.
2 - While I have a rain gauge set up in the rear yard, it is only being used as a guide but it is noted that it is relatively consistent with official figures occurring at nearby Prospect and Horsley Park where official weather stations are established.

