[ad_1]

https://
[ad_2]
Source
Places
Storm types
Pages
Chasers

drought · General Weather
 Summer heat ends in showers and storms NSW – 18 and 19 December 2021
19 Dec 2021 · New South Wales
Summer heat ends in showers and storms NSW – 18 and 19 December 2021
19 Dec 2021 · New South Wales
 Sydney Storms Lightning Spectacular 18th December 2021
19 Dec 2021 · Sydney, NSW
Sydney Storms Lightning Spectacular 18th December 2021
19 Dec 2021 · Sydney, NSW
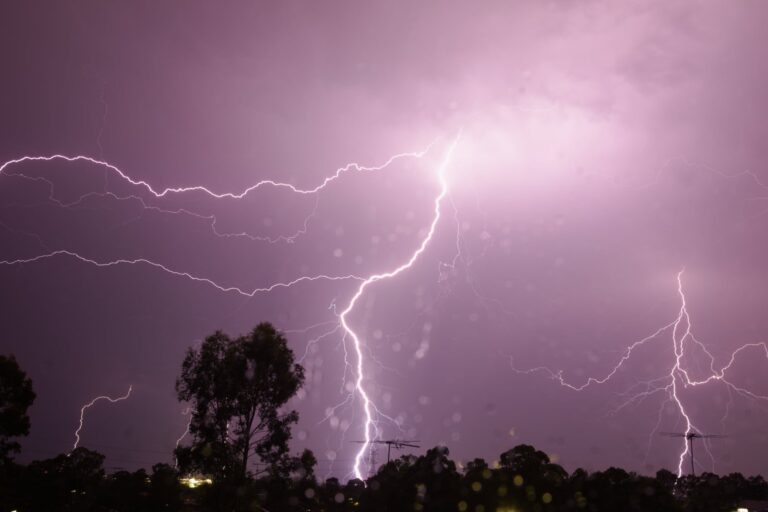 Last night’s lightning was spectacular – this was one lightning exchange. More to come
www.extremestorms.com.au
Not for media use licensing availab…
19 Dec 2021 · Sydney, NSW
Last night’s lightning was spectacular – this was one lightning exchange. More to come
www.extremestorms.com.au
Not for media use licensing availab…
19 Dec 2021 · Sydney, NSW
 This graphic says it all – already 40C in Penrith and the radar is showing multiple plumes 19th December 2019
19 Dec 2019 · Penrith, NSW
This graphic says it all – already 40C in Penrith and the radar is showing multiple plumes 19th December 2019
19 Dec 2019 · Penrith, NSW
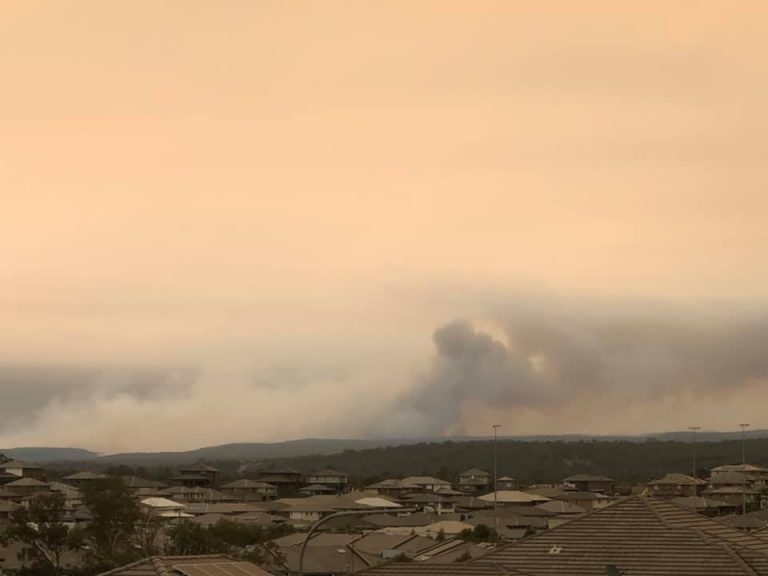 Fires from 3 minute walk to lookout – Saturday will bring fires closer 19th December 2019
19 Dec 2019 · Warragamba, NSW
Fires from 3 minute walk to lookout – Saturday will bring fires closer 19th December 2019
19 Dec 2019 · Warragamba, NSW
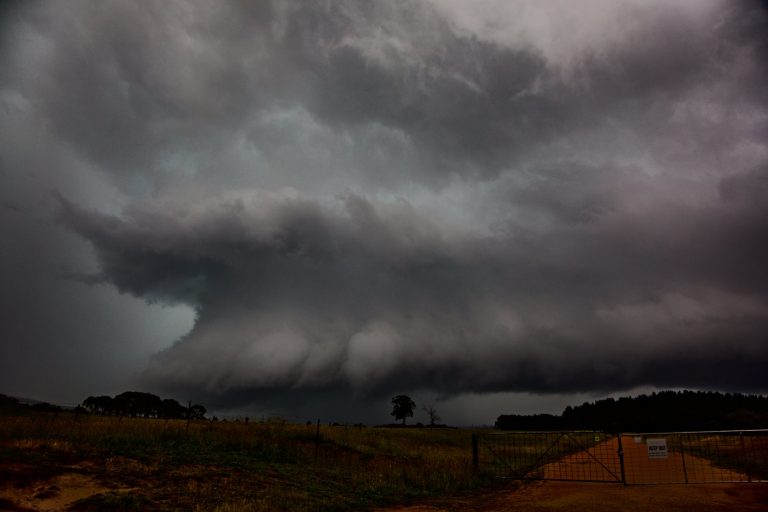 Severe Storm Structures Lithgow as Mudgee to Merriwa Supercell goes begging 19th December 2018
19 Dec 2018 · Lithgow, NSW
Severe Storm Structures Lithgow as Mudgee to Merriwa Supercell goes begging 19th December 2018
19 Dec 2018 · Lithgow, NSW
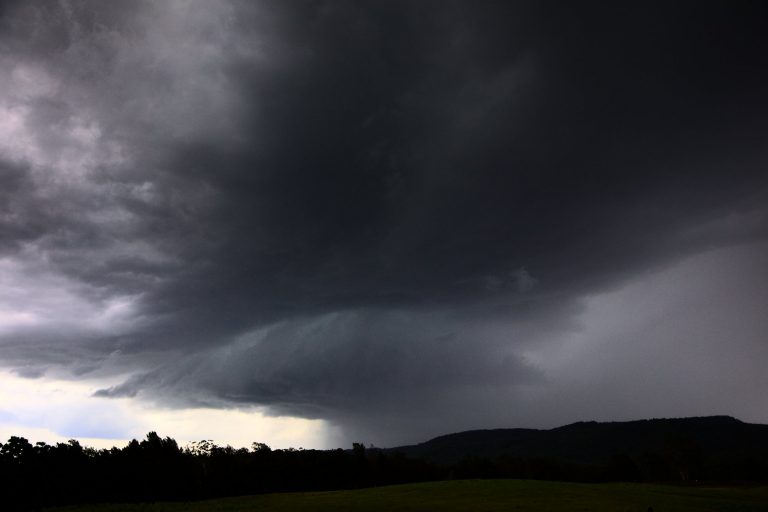 Hunter Valley Severe Storms 16th December 2018
19 Dec 2018 · Hunter Valley, NSW
Hunter Valley Severe Storms 16th December 2018
19 Dec 2018 · Hunter Valley, NSW
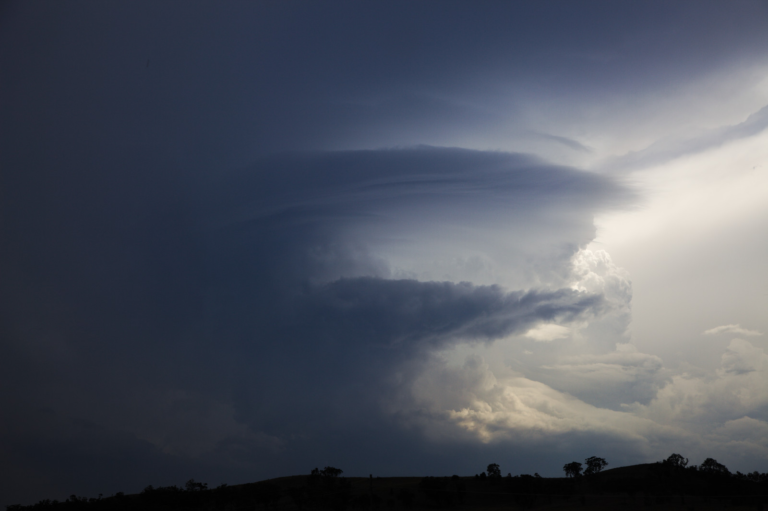 Structured Storms approaches Broke 18th December 2017
19 Dec 2017 · Broke, NSW
Structured Storms approaches Broke 18th December 2017
19 Dec 2017 · Broke, NSW
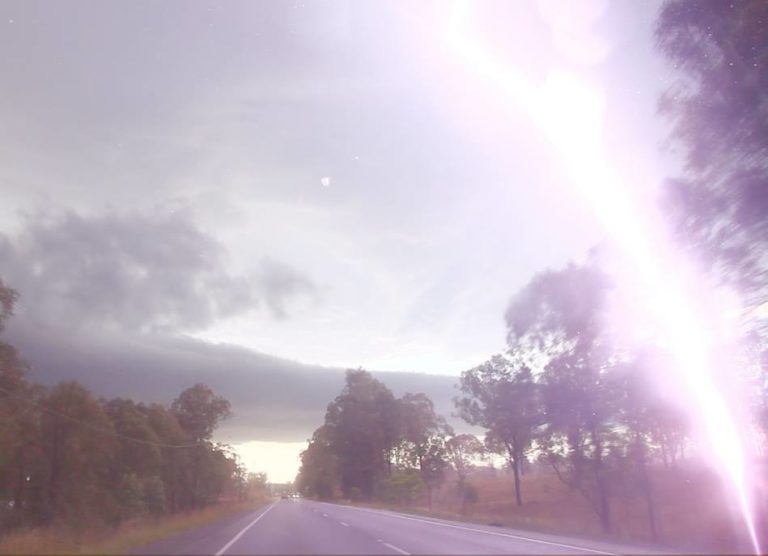 Kyogle to Beaudesert Supercell – Lightning hits tree
19 Dec 2016 · Kyogle to Beaudesert, QLD
Low pressure developing for the Sydney to Hobart yacht race
19 Dec 2006 · Sydney to Hobart, TAS
Kyogle to Beaudesert Supercell – Lightning hits tree
19 Dec 2016 · Kyogle to Beaudesert, QLD
Low pressure developing for the Sydney to Hobart yacht race
19 Dec 2006 · Sydney to Hobart, TAS
You must be logged in to post a comment.
Very important points and although the video will be swept aside as data were “not official“, the intense bushfires, 500 people dying from heat and animals including dingos, kangaroos and birds just dropping dead from the extreme cannot be ignored! Sadly the temperatures are being ignored because if changes in quality control a d not included.
There was no air con back then. No one is reporting Animal death numbers at present and one extreme event versus a serious of them in last ten years now does not prove anything.
The problem with this guy’s premise is that he is mostly comparing the records for NSW, which is only one state of Australia. Alternatively, he cherry picks the hottest days for individual towns or cities as opposed to the overall average of all the readings in Australia for one day.
The reason the girl is standing in front of the eastern part of the map is not for any conspiratorial reason but that she was pointing to the temperatures in the west. If the picture was taken earlier she would have been pointing to the temperatures on the east coast. We are currently having a dreadful heatwave across Australia and when they say the hottest day it means adding up all the temperatures and averaging them. Australia is a very big country so some parts are always cooler than others. As well, the old records are in the archives.
The Australian Bureau of Meteorology is reputable and does not push any political ideology. The BOM did NOT say that the heat was due to carbon dioxide levels but explained that it was due to a positive Indianan ocean dipole and a neutral El Nino. The BOM data shows recent trends for it to be heating up. The data starts from a time when the records are considered to be reliable.
Also, if we did not have air conditioning 500 people would probably die from the heat waves.
I do not consider this guy to be a very credible. His argument is all persuasive based on cherry picking data – another Al Gore type. As they say you can manipulate the same statistics to prove anything.
No one talks of the El Niño and La Mina cycles of drought and flood – have they been erased from terminology
The biggest problem is that this fellow is comparing January records to what we are experiencing in December. That month in the future has not happened yet and will be a completely different story.